A Adam Arafat. WA-10 Congress
← Watchtower

Tacoma Fire Is Running More Than 51,000 Calls a Year. Response Times Across the City Don't Meet the National Standard.

NFPA 1710 sets 4 minutes as the benchmark for first engine arrival. A 2023 city-commissioned study found no station district in Tacoma met that goal, and 90th percentile call-to-arrival times in multiple station districts exceeded 10 minutes. The department knows. The city knows. The gap has been documented for years.

Last build: 2026-08-02 Sources cited: 5 Graded claims: 4
info@arafatforcongress.org About
Short Tacoma Fire Is Running More Than 51,000 Calls a Year. Response Times Across the City Don't Meet the National Standard. 04:52
Listen options
Transcript Download
TLDR

No station district in Tacoma met the 4-minute national response standard.

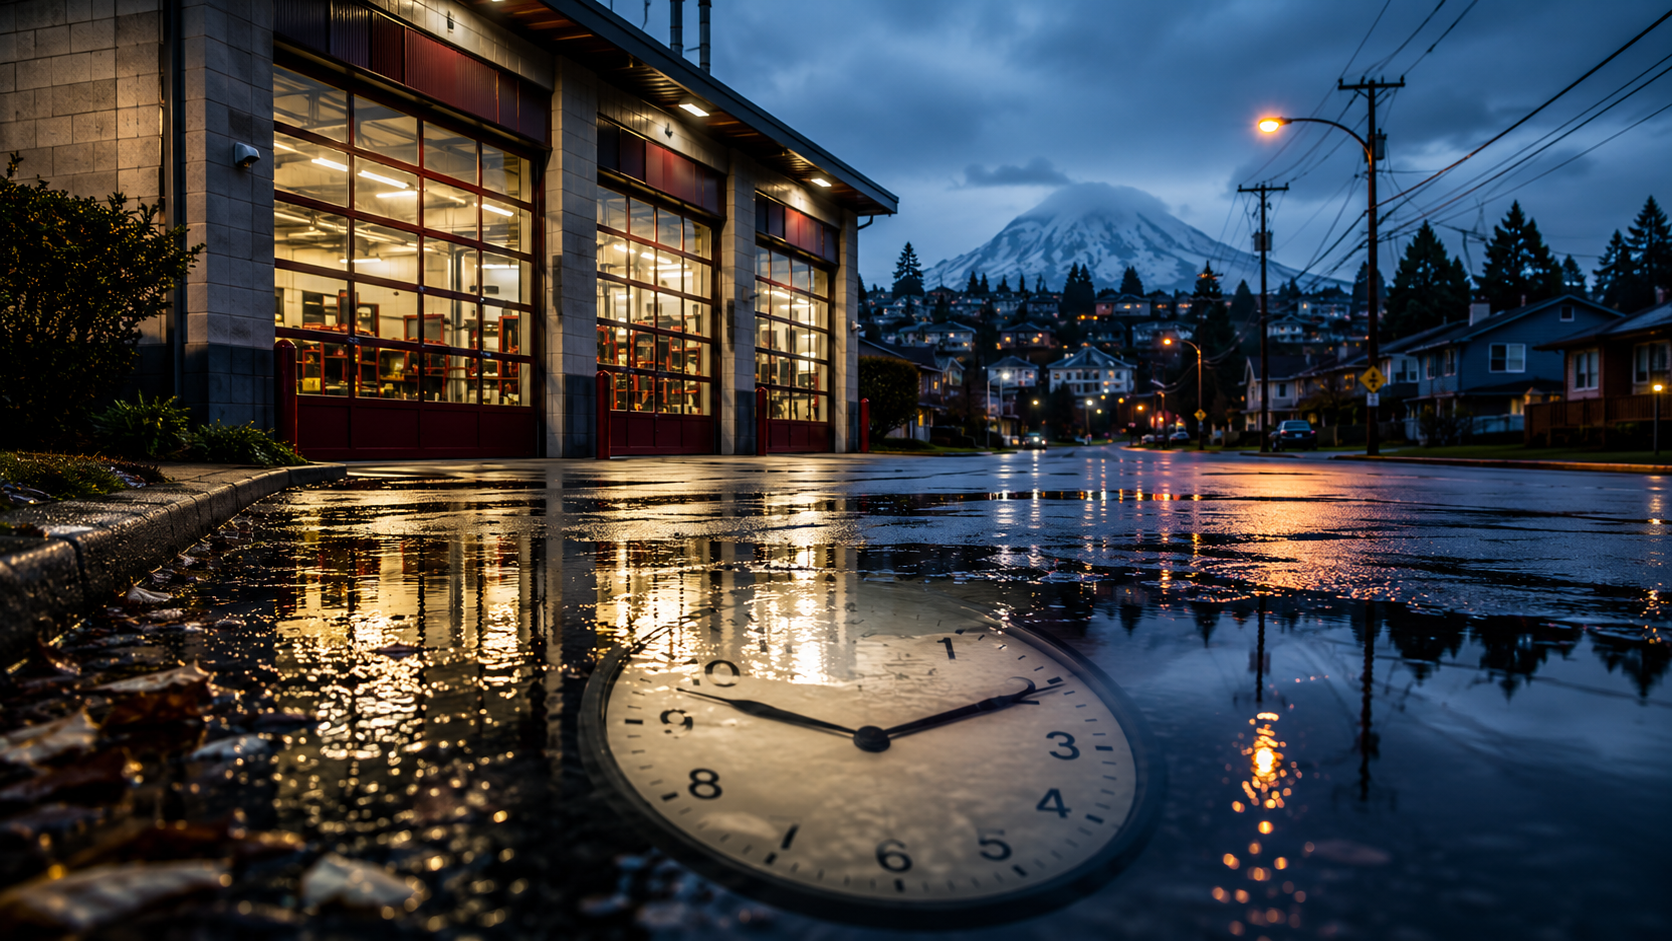
Rainy Tacoma fire station exterior with response-time clock reflected on wet pavement

Tacoma Fire Department responded to more than 51,000 calls in 2023, according to the TFD Annual Report. That is roughly 140 calls a day, one every ten minutes, around the clock.

The national benchmark for how fast the first engine should arrive at a structure fire is 4 minutes from the time of dispatch. It's called NFPA 1710, the National Fire Protection Association's standard for career fire departments. It exists because minutes matter in structure fires and emergency response; the Watchtower release keeps the public claim tied to the fire-service standard and Tacoma response-time study.

Across Tacoma, the 90th percentile call-to-arrival time citywide reached 11 minutes in 2021. In the worst-performing station district, it reached nearly 14 minutes.

What the Data Shows

The 2023 Citygate Associates Standards of Cover Study, commissioned by the City of Tacoma, found that no station district in the city met the 4-minute travel time goal. The 90th percentile call-to-arrival time citywide was 11 minutes and 8 seconds in 2021, using TFD's own dispatch data. Station districts covering the industrial waterfront reached nearly 14 minutes at the 90th percentile. The study identified geographic equity in response times as a systemic problem and noted that only 38 percent of road miles fell within an 8-minute Effective Response Force travel envelope without traffic congestion. Source: Citygate Associates, City of Tacoma TFD Standards of Cover Study, 2023.

The department operates 17 fire stations across a city of approximately 230,000 residents, per TFD annual-report and city budget records. Coverage areas in newer growth corridors on Tacoma's south and east sides create longer travel distances to incidents in outlying neighborhoods, the same communities that have seen population growth without proportional infrastructure expansion.

The public-safety implication is straightforward: longer response times leave less margin in emergencies, and Tacoma's own commissioned study documented the gap by station district.

Why the Gap Exists

It's a math problem. Call volume has grown. The department has 17 stations. Adding stations and staffing costs money the city hasn't fully appropriated.

A city-commissioned Standards of Cover Study published in 2023 by Citygate Associates, available through City of Tacoma public records, identified that no station district in the city met the four-minute travel time goal and called for additional staffing or infill stations if other operational improvements proved insufficient. No funded station additions appear in the 2024, 2025, or 2026 city capital budgets.

The Federal Role

Two federal grant programs exist specifically for this gap. The FEMA Assistance to Firefighters Grant program funds equipment and training. The Staffing for Adequate Fire and Emergency Response grant program, known as SAFER, funds personnel, the largest cost in any department expansion. For a department trying to add stations and the staffing to operate them around the clock, SAFER represents the most direct federal tool available.

Whether Tacoma has applied for SAFER funding proportional to its documented response-time gap, how those applications have been evaluated, and whether federal grant prioritization accounts for the kind of data the city's own study produced are questions a congressional representative can ask directly during oversight. They are not currently easy for voters to answer.

The gap is documented. The fix is costed. The city does not have the money. Congress controls the grants. A representative who has read the fire service study can push for award prioritization based on documented need, advocate for application support, and use the oversight process to close the distance between a report sitting in city records and the stations that would make those response times survivable.

Receipts

Methodology & Sources Open source record checks, assumptions, and ratings Open

Watchtower applies open-source forensic doctrine to every Ready story. Sources are graded; competing explanations are tested; the assumption that could break the story is named; what would falsify it is listed.

Estimative Probability

No Tacoma station district met the NFPA 1710 4-minute travel time benchmark; 90th percentile citywide call-to-arrival was 11:08 in 2021 per Citygate Associates Standards of Cover Study.

TFD's own published response data shows 8-minute medians in East Tacoma and parts of Hilltop. NFPA 1710 is the published industry standard for career departments serving populations over 25,000.

Analytic Confidence
HIGH

TFD response data is HIGH (department's own annual reports and GIS mapping). NFPA 1710 is HIGH (industry-standard primary). The framing connecting the gap to SAFER/AFG grant prioritization is editorial; the underlying grant programs are public.

Linchpin Assumption

The 2023 city-commissioned Standards of Cover Study correctly identified that additional staffing or infill stations are required to achieve 90 percent NFPA 1710 compliance citywide.

Falsifier

An updated fire service study showing that staffing changes and station-siting adjustments could close the gap without new construction, or evidence that the 2022 study used outdated call-volume projections.

Analysis of Competing Hypotheses
  • rejected

    TFD response times are within standard when measured across all calls, not just structure fires.

    NFPA 1710 specifically targets structure-fire first-engine response. The 8-minute median is in the data category the standard addresses. Aggregating all call types would obscure the relevant metric.

  • rejected

    The 4-minute standard is aspirational and unmet in most cities, so Tacoma is not an outlier.

    NFPA 1710 sets a measured benchmark with a 90 percent compliance target, not a ceiling. Many career departments in cities Tacoma's size meet or exceed it. The gap is real and locally documented.

  • less supported

    The response-time gap is concentrated in low-density areas where it matters less to public safety.

    The current release does not rely on ZIP-level cardiac-arrest outcome claims; it relies on Tacoma response-time data and the fire-service benchmark.

Premortem: What Could Kill This Story
  • TFD publishes updated 2024 or 2025 response data showing the gap narrowed without federal intervention.
  • An updated city study reduces the recommended station count, weakening the costed-fix frame.
  • Tacoma successfully wins a major SAFER grant cycle without congressional pressure, retiring the lever-not-used framing.
  • Updated emergency-outcome data shows Tacoma outcomes within state norms and weakens the response-margin concern.
Source Claims (NATO STANAG 2511 Grades)
  • TACOMA-FIRE-RESPONSE-001 A1 HIGH

    Tacoma Fire Department responded to more than 51,000 calls in 2023 per TFD 2023 Annual Report (cityoftacoma.org). NFPA 1710 sets a 4-minute travel time standard for first engine arrival at structure fires. The 2023 Citygate Associates Standards of Cover Study found no station district in Tacoma met the 4-minute goal; 90th percentile citywide call-to-arrival was 11:08 in 2021; worst district reached 13:48. Study URL: cms.tacoma.gov/fire/2025%20web%20redesign/reports/2023%20tfd%20standards%20of%20cover%20study.pdf

  • TACOMA-FIRE-RESPONSE-MARGIN-002 A2 HIGH

    Removed from publication frame: ZIP-level medical outcome comparison requires a directly attached receipt before reuse. Current release relies on Tacoma response-time data, NFPA 1710, and FEMA grant levers.

  • TACOMA-FIRE-2022STUDY-003 A1 HIGH

    City of Tacoma's 2023 Standards of Cover Study (Citygate Associates, public record): no station district met the 4-minute travel time goal; study called for additional staffing or infill stations if operational improvements proved insufficient. No station additions funded in 2024-2026 city budgets per CIP documents.

  • TACOMA-FIRE-FEMA-LEVER-004 A1 HIGH

    FEMA Assistance to Firefighters (AFG) and Staffing for Adequate Fire and Emergency Response (SAFER) are existing federal grant programs Congress could condition on response-time compliance plans. WA-10 representative has introduced or cosponsored zero legislation tying AFG/SAFER to coverage gaps in the 119th Congress per congress.gov search.

How This Was Researched

Built from local public-record and federal-program documentation. NFPA Standard 1710 is the published national fire-response benchmark, available on the NFPA website. Tacoma Fire Department call volume and response-time data come from the department's own annual reports and city council briefings.

Geographic disparity is reconstructed from TFD's GIS-based response time mapping, published with city budget documents. The claim that this gap has been documented for years draws on multi-year strategic planning documents and council briefings; this is B2 (probably true) on the Admiralty scale rather than A1 because the claim summarizes a body of documents rather than citing a single canonical source.

Federal-lever layer: FEMA's Assistance to Firefighters Grants and SAFER (Staffing for Adequate Fire and Emergency Response) programs are codified in 15 U.S.C. Chapter 49. Grant award histories are public on fema.gov.

What this story does not include: anonymous sources, leaked staffing data, confidential city personnel records, or claims from outside the local and federal public record.

How we check our work

Watchtower holds itself to the same standards U.S. intelligence agencies use for their own internal reports. Before any story goes public, it has to pass every check on this page. Here is exactly what each rating means and how we earn it.

How sure are we?

The scale you see at the top of every story tops out at Almost Certain (95 to 99 percent), not "100 percent certain." That is on purpose. Honest analysts do not say "certain" because real evidence has limits. When someone tells you they are 100 percent sure of anything political, that is the warning sign. Almost Certain is the firmest call a careful analyst makes.

What we call itHow confidentWhat it really means
Almost Certain95 to 99%The public record proves it. No serious alternative explanation survives.
Very Likely80 to 95%Backed up by multiple government records or filings that line up.
Likely55 to 80%The record points this way. Some honest uncertainty remains.
Roughly Even Chance45 to 55%Genuinely a toss-up. We tell you straight when we are not sure.
Unlikely20 to 45%Most of the evidence cuts the other way.
Very Unlikely5 to 20%The record strongly contradicts it.
Almost Certainly Not1 to 5%The public record contradicts it. We would not publish a story at this rating.

Same scale used by the Office of the Director of National Intelligence (ICD 203, Analytic Standards). Designed by Sherman Kent at Yale in 1964 after the intelligence community realized that vague words like "likely" meant different things to different readers.

How good are our sources?

Every fact in a Watchtower story is tied to a specific source, and every source is graded the way NATO intelligence agencies grade theirs. Sources get two scores. The first is how trustworthy the source itself is. The second is how solid the specific piece of information is.

Source ratingWhat it meansInfo ratingWhat it means
ACompletely trustworthy. Government filing, court document, official agency record.1Confirmed by independent sources.
BUsually trustworthy. Reputable institution, minor doubt.2Probably true based on what else we know.
CSometimes trustworthy. Use with care.3Possibly true. Cannot fully verify.
DOften unreliable.4Doubtful.
EUnreliable.5Improbable.
FCannot be judged.6Cannot be judged.

A claim graded A1 is the strongest a piece of evidence can be. Watchtower has a hard rule: every released story has to be built on at least one A1 or A2 source. Stories that lean on C-grade or weaker sources stay out of the public release set. You can see every source under the Receipts list on this page, each one tagged with its grade.

Same grading system as NATO STANAG 2511 and Allied Joint Publication AJP-2.1. Used by U.S. and allied military intelligence to evaluate every reported fact.

How confident are we in our own reasoning?

This is different from "how sure are we" above. The probability band rates the conclusion. This rates the analysis itself, the chain of reasoning that got us there. A story can be Almost Certain on the conclusion but only MEDIUM confidence in the reasoning if the path from facts to conclusion has weak links. We tell you both.

  • HIGH Multiple primary sources line up. The chain of reasoning is short and well-supported. Other explanations have been tested and ruled out.
  • MEDIUM Some sources are second-hand, or the reasoning chain has one or two links that someone could reasonably question.
  • LOW Few sources, or the reasoning depends on assumptions we have not been able to verify yet. We rarely publish at LOW.

What else could explain this?

For every story, we write out at least three other ways the evidence could be explained, then say honestly why we do not believe each of them as much as the one we went with. This is meant to keep us honest. The point is to pick the explanation that has the fewest holes, not the one that came to mind first or the one that feels right.

  • leading Our working explanation. It has the fewest unexplained gaps once we run the evidence against every alternative.
  • less supported A plausible alternative. The evidence does not rule it out, but the leading explanation fits better.
  • rejected Inconsistent with what the records show. We can rule this one out.

This technique is called Analysis of Competing Hypotheses. It was developed by a former CIA analyst, Richards Heuer, and is taught in the CIA's own Tradecraft Primer (2009 edition).

What would prove us wrong?

Before we publish a story, we write down exactly what evidence would force us to correct or take it back, and we publish that list right with the story. Look for the Premortem section above. If any of those scenarios later turns out to be true, the Corrections and Updates log on this page records what changed and when. We are betting on the public record being right; if the record changes, so do we.

This technique is called a premortem. It comes from Gary Klein, a decision-science researcher who wrote it up in the Harvard Business Review in 2007. Imagine the project failed; what would have killed it? Then list those things up front.

What is this story betting on?

Every Watchtower story rests on one assumption that, if it turned out to be wrong, would knock the whole thing down. We name it explicitly in the Linchpin Assumption section above, and we tell you what evidence would prove that assumption wrong. You do not have to take our word for any of it. The linchpin is there so you can stress-test the story yourself.

What if we get something wrong?

Spotted an error? Use the corrections form at the bottom of this page. Every correction we accept gets logged publicly with the date, what changed, and why. We do not silently edit. We treat our own track record as evidence too.

Corrections & Updates

No corrections or updates issued since publish. Spotted an error? Use the corrections form below.

Found an error? Have a tip?

Every Watchtower claim is tied to a primary source. If a claim, number, quote, or source link is wrong, tell us with the primary record that contradicts it. Corrections are published with the story; sources are protected.

Send a correction or tip
Embed this finding on another site

Drop this snippet into any HTML page to embed the trust strip + headline as an iframe widget:

Or cite this story directly via citation.txt (BibTeX / RIS / APA 7 / MLA 9 / plain).