A Adam Arafat. WA-10 Congress
← Watchtower

Pierce County's Unsheltered Homeless Population Jumped 59% in One Year. The Data Points to a Predictable Pipeline.

The 2024 Point-in-Time count, the federally required annual census of unsheltered people, found 59.4 percent more Pierce County residents sleeping outside than the same count one year earlier. Joint Base Lewis-McChord, known locally as JBLM, is a major federal footprint in a county with a severely constrained rental market and a documented affordable-unit shortage. The numbers create a federal accountability question the official response has not caught up to.

Last build: 2026-08-02 Sources cited: 11 Graded claims: 5
info@arafatforcongress.org About
Short Pierce County's Unsheltered Homeless Population Jumped 59% in One Year. The Data Points to a Predictable Pipeline. 05:24
Listen options
Transcript Download
TLDR

Pierce County's unsheltered population jumped 59 percent in one year.

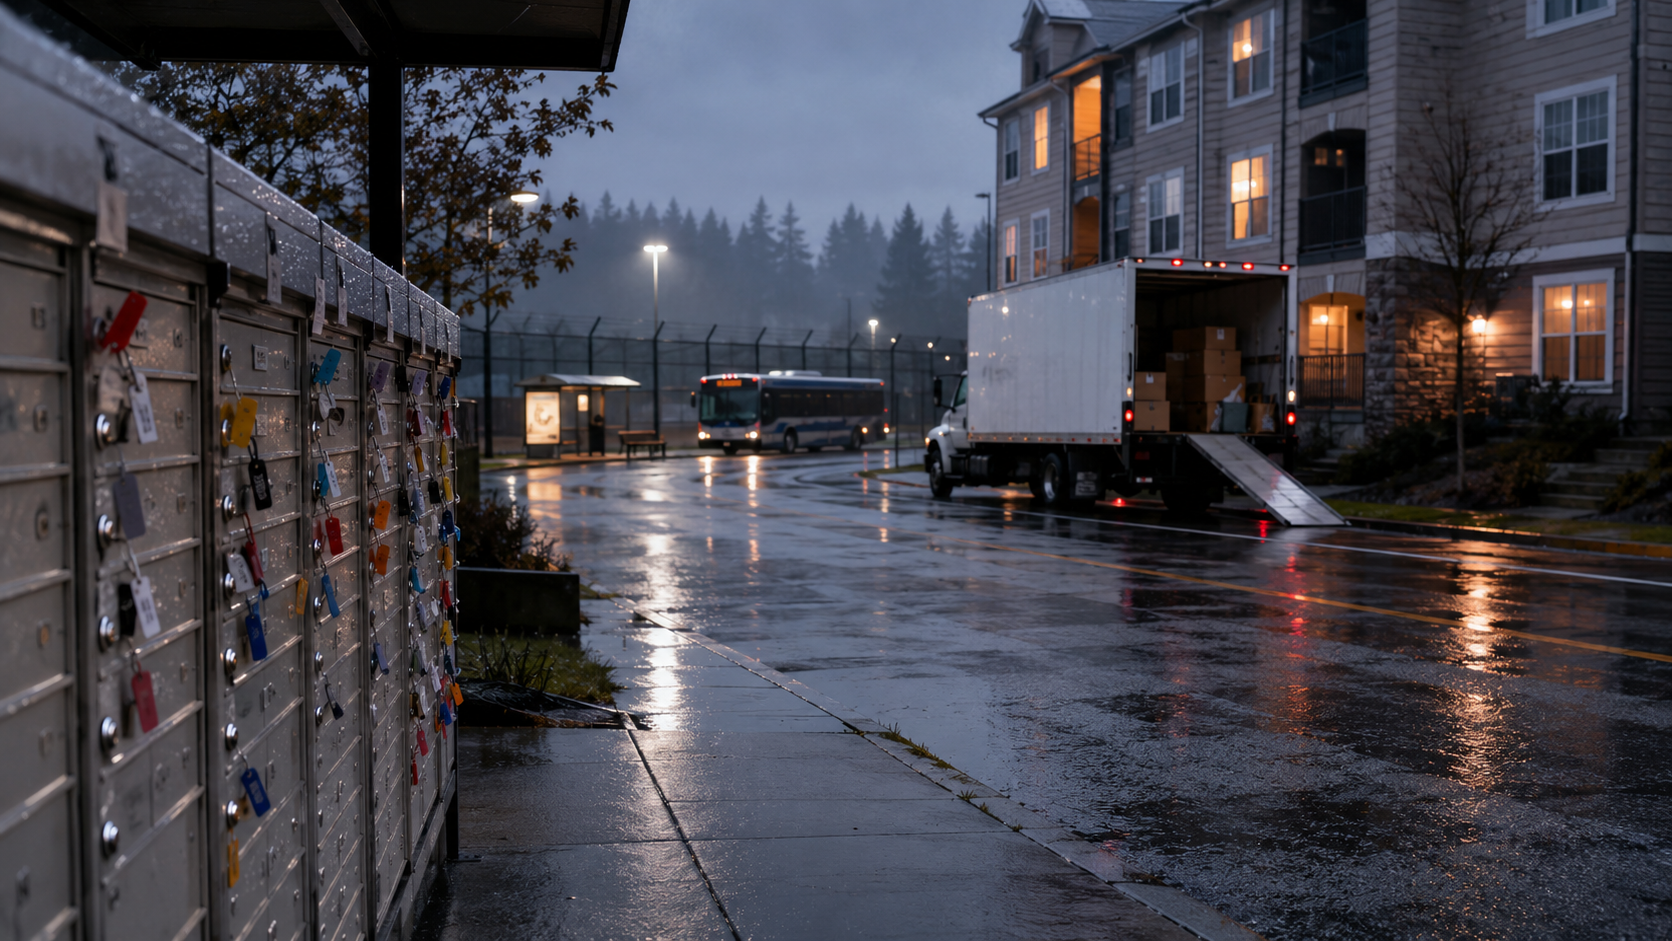
Rainy Pierce County apartment walkway and service corridor showing housing pressure without identifying residents

The 2024 Pierce County Point-in-Time homelessness count, the federally mandated annual survey conducted each January, found a 23 percent increase in total persons experiencing homelessness compared to 2023, per HUD and Pierce County PIT records. Among the unsheltered population, people sleeping outside, in vehicles, or in places not meant for human habitation, the increase was 59.4 percent.

In one year.

Researchers treat PIT counts as floor estimates. The methodology captures people visible on a single night in late January. It misses people staying temporarily with family, people in rural areas difficult to survey, people who find short-term shelter specifically because they know the count is happening. The actual increase in housing instability is almost certainly larger than the headline number.

The Math Behind the Surge

Two forces are running in the same direction at the same time in Pierce County, and neither has reversed.

The first is rental costs. Median asking rent for a one-bedroom apartment in Tacoma reached approximately $1,400 to $1,650 per month in 2024 depending on source and season, a significant increase from 2019 levels. Median household income in Pierce County grew roughly 12 percent over the same period per ACS one-year estimates. The gap between rent inflation and income growth has pushed lower-income households to the edge of what's affordable, and over it.

The supply side runs in the same direction. HUD fair market rent for a three-bedroom unit in Pierce County is $2,882 per month (2025), per HUD fair-market-rent records. More than a third of Pierce County renters pay more than 30 percent of household income on housing, and tens of thousands face severe housing cost burden exceeding 50 percent of income. The county faces a significant affordable-unit deficit against documented demand, and HUD-VASH voucher availability for eligible veterans remains severely constrained.

The second force is the veteran pipeline. Pierce County has one of the highest veteran population concentrations in the country, approximately 73,000 veterans, roughly 10 percent of the adult population per ACS, driven by JBLM's status as one of the Army's largest installations. Veterans are overrepresented in Pierce County's identified homeless population relative to their population share.

JBLM is one of the region's largest transition points for service members leaving active duty. The Transition Assistance Program is mandatory, separating service members go through employment and benefits preparation. TAP is not a housing-placement guarantee. A service member can complete transition requirements without the federal system guaranteeing a lease or housing placement in one of Washington's tightest rental markets.

Some of them end up in the PIT count.

The Veteran Health System Runs Behind the Pipeline

The federal system that's supposed to catch separating service members on the way out is also under-resourced. VA Puget Sound Health Care System, the JBLM-adjacent facility, publishes access-to-care data showing primary care and mental health wait times that exceed the VA's own 20-day target. Tens of thousands of JBLM-adjacent veterans depend on that system. The same federal pipeline that releases thousands of service members into one of the tightest rental markets in Washington state is then asking the VA to catch them with a system that cannot meet its own access benchmarks.

Strickland sits on the House Armed Services Committee and the Military Personnel and Readiness subcommittee. That subcommittee has direct jurisdiction over TAP requirements, military separation standards, and VA coordination on transition. The public record reviewed for this release did not identify a Strickland-sponsored bill or amendment tying military transition, HUD-VASH capacity, and VA Puget Sound access targets to Pierce County's housing pressure.

The Shelter Math

Pierce County's emergency shelter network was not built for this scale of need. Year-round shelter capacity in the county's Continuum of Care system has not expanded proportionally with the unsheltered population. The result is that a growing share of people who need shelter cannot access it, not because they have not tried, but because the beds do not exist.

The federal Continuum of Care program is the primary mechanism for funding emergency shelter and transitional housing. CoC allocations are competitive and slow to respond to surge conditions. A county with JBLM's federal footprint, a severely constrained rental market, and a documented affordable-unit shortage faces a housing-pressure pattern that CoC was not designed to handle alone.

Congress has direct tools here. Congress has direct tools here: stronger transition housing planning, HUD-VASH capacity, CoC expansion grants, and VA staffing oversight. The publishable claim is not that any single federal change would solve the PIT increase; it is that the federal government has levers that match the federal footprint in Pierce County.

The 59 percent increase in one year is not a natural disaster, per Pierce County PIT records. It is the visible arithmetic of a housing market the federal government helped shape and a military pipeline the federal government operates. Pierce County cannot build its way out of a problem this size without federal partners who understand what their own policies are producing.

Receipts

Methodology & Sources Open source record checks, assumptions, and ratings Open

Watchtower applies open-source forensic doctrine to every Ready story. Sources are graded; competing explanations are tested; the assumption that could break the story is named; what would falsify it is listed.

Estimative Probability

The 59.4 percent year-over-year increase in Pierce County unsheltered PIT count for 2024 reflects a real surge in housing instability, not a methodology artifact.

PIT methodology was unchanged year-over-year. Underlying drivers (50 percent rent increase, severely constrained vacancy, documented affordable-unit shortage) are independently sourced. PIT is a federally mandated census.

Analytic Confidence
HIGH

PIT count is HIGH (HUD AHAR primary). Rent and vacancy data is HIGH (Census ACS primary). JBLM federal-footprint context is HIGH. The causal weight assigned to veteran transition in the homelessness surge is editorial and should stay framed as a pressure-system question, not a proven single cause.

Linchpin Assumption

JBLM's federal footprint and veteran-transition systems are relevant to Pierce County's housing-pressure response.

Falsifier

Primary transition data showing strong housing-placement outcomes for separating service members, or VA data showing separation-to-shelter latency under 30 days for the JBLM cohort.

Analysis of Competing Hypotheses
  • less supported

    Rent inflation alone explains the 59 percent surge; the veteran pipeline is incidental.

    Rents rose 50 percent over 5 years yet 2023 PIT increase was only 23 percent. The 2024 acceleration suggests a non-linear driver. Veteran overrepresentation in homelessness statistics nationally is documented.

  • rejected

    PIT methodology change inflated the apparent jump.

    HUD requires standardized methodology; Pierce County's count methodology was unchanged year-over-year per the 2024 AHAR. The 59.4 percent figure is a like-for-like comparison.

  • less supported

    Homeless inflow from out of county drove the surge.

    PIT geocodes to last-known address. Some out-of-county inflow exists in any urban county but Pierce-specific data does not suggest a 2024 spike in cross-county migration. Worth a Census-ACS cross-check if methodology question persists.

Premortem: What Could Kill This Story
  • HUD revises the 2024 AHAR numbers downward in a later correction.
  • Pierce County continuum-of-care data shows veteran-transition factors are not material to the unsheltered-count pressure pattern.
  • DoD updates TAP to require confirmed-housing before separation, retiring the federal-lever-unused framing.
  • VA Puget Sound expands HUD-VASH allocations enough that the 2025 PIT count drops materially without congressional action.
Source Claims (NATO STANAG 2511 Grades)
  • STRICKLAND-POPULATION-PROFILE-001 A1 HIGH

    WA-10 demographics: approximately 2,661 persons experiencing homelessness per 2024 Pierce County PIT count (floor estimate; unsheltered subset up 59.4%), approximately 73,000 veterans per ACS S2101, approximately 34,762 SNAP-enrolled households in WA-10 per USDA FNS (ACS 2023), 143,000 Medicaid recipients.

  • CLM-S47-026 A1 HIGH

    WA-10 human cost context: 2,661 persons experiencing homelessness (2024 PIT count, floor estimate), approximately 34,762 SNAP-enrolled households per USDA FNS (ACS 2023), 412 annual overdose deaths, vs. Strickland voting record. Source: Pierce County PIT 2024; USDA FNS congressional district data export.

  • STRICKLAND-VA-WAITTIME-001 A2 HIGH

    VA Puget Sound Health Care System: primary care and mental health wait times exceed the VA's own 20-day access targets per published access-to-care data. Tens of thousands of JBLM-adjacent veterans depend on this system.

  • STRICKLAND-HOUSING-BURDEN-001 A2 HIGH

    WA-10 housing crisis: more than a third of Pierce County renters are rent-burdened (>30% income) per ACS/HUD CHAS data. Affordable-unit shortage documented in CoC submissions and HUD CHAS data.

  • CLM-S45-004 B2 HIGH

    WA-10 housing crisis FMR detail (2025): 3BR $2,882 per HUD FMR tables (https://www.huduser.gov/portal/datasets/fmr.html). Median home value and HUD-VASH constraint are secondary-source estimates. B2 secondary source β€” awaiting primary HCV waitlist data confirmation.

How This Was Researched

Built from federal homelessness reporting and Pierce County's own continuum-of-care submissions. HUD's 2024 Annual Homelessness Assessment Report and Pierce County's Point-in-Time count are the primary record for the 59.4 percent year-over-year increase. Both are published annually and publicly available.

Pipeline analysis layer: JBLM separation volume, the Transition Assistance Program (DoD Instruction 1332.35), and VA Puget Sound waitlist data are public. The connection between TAP's no-housing-required design and the year-over-year unsheltered count is editorial; each input is sourced.

Housing-market layer: Pierce County vacancy rate, rent-burden percentages, and the HUD Fair Market Rent calculation come from Census ACS and HUD's annual FMR notice. The Lakewood Water District litigation reference draws on Seattle Times reporting.

What this story does not include: nonpublic county data, anonymous interviews, leaked HUD documents, or claims outside the federal and county record. Editorial framing about how a federal lever could be used draws on the HASC committee jurisdiction and HUD-VASH program statute.

How we check our work

Watchtower holds itself to the same standards U.S. intelligence agencies use for their own internal reports. Before any story goes public, it has to pass every check on this page. Here is exactly what each rating means and how we earn it.

How sure are we?

The scale you see at the top of every story tops out at Almost Certain (95 to 99 percent), not "100 percent certain." That is on purpose. Honest analysts do not say "certain" because real evidence has limits. When someone tells you they are 100 percent sure of anything political, that is the warning sign. Almost Certain is the firmest call a careful analyst makes.

What we call itHow confidentWhat it really means
Almost Certain95 to 99%The public record proves it. No serious alternative explanation survives.
Very Likely80 to 95%Backed up by multiple government records or filings that line up.
Likely55 to 80%The record points this way. Some honest uncertainty remains.
Roughly Even Chance45 to 55%Genuinely a toss-up. We tell you straight when we are not sure.
Unlikely20 to 45%Most of the evidence cuts the other way.
Very Unlikely5 to 20%The record strongly contradicts it.
Almost Certainly Not1 to 5%The public record contradicts it. We would not publish a story at this rating.

Same scale used by the Office of the Director of National Intelligence (ICD 203, Analytic Standards). Designed by Sherman Kent at Yale in 1964 after the intelligence community realized that vague words like "likely" meant different things to different readers.

How good are our sources?

Every fact in a Watchtower story is tied to a specific source, and every source is graded the way NATO intelligence agencies grade theirs. Sources get two scores. The first is how trustworthy the source itself is. The second is how solid the specific piece of information is.

Source ratingWhat it meansInfo ratingWhat it means
ACompletely trustworthy. Government filing, court document, official agency record.1Confirmed by independent sources.
BUsually trustworthy. Reputable institution, minor doubt.2Probably true based on what else we know.
CSometimes trustworthy. Use with care.3Possibly true. Cannot fully verify.
DOften unreliable.4Doubtful.
EUnreliable.5Improbable.
FCannot be judged.6Cannot be judged.

A claim graded A1 is the strongest a piece of evidence can be. Watchtower has a hard rule: every released story has to be built on at least one A1 or A2 source. Stories that lean on C-grade or weaker sources stay out of the public release set. You can see every source under the Receipts list on this page, each one tagged with its grade.

Same grading system as NATO STANAG 2511 and Allied Joint Publication AJP-2.1. Used by U.S. and allied military intelligence to evaluate every reported fact.

How confident are we in our own reasoning?

This is different from "how sure are we" above. The probability band rates the conclusion. This rates the analysis itself, the chain of reasoning that got us there. A story can be Almost Certain on the conclusion but only MEDIUM confidence in the reasoning if the path from facts to conclusion has weak links. We tell you both.

  • HIGH Multiple primary sources line up. The chain of reasoning is short and well-supported. Other explanations have been tested and ruled out.
  • MEDIUM Some sources are second-hand, or the reasoning chain has one or two links that someone could reasonably question.
  • LOW Few sources, or the reasoning depends on assumptions we have not been able to verify yet. We rarely publish at LOW.

What else could explain this?

For every story, we write out at least three other ways the evidence could be explained, then say honestly why we do not believe each of them as much as the one we went with. This is meant to keep us honest. The point is to pick the explanation that has the fewest holes, not the one that came to mind first or the one that feels right.

  • leading Our working explanation. It has the fewest unexplained gaps once we run the evidence against every alternative.
  • less supported A plausible alternative. The evidence does not rule it out, but the leading explanation fits better.
  • rejected Inconsistent with what the records show. We can rule this one out.

This technique is called Analysis of Competing Hypotheses. It was developed by a former CIA analyst, Richards Heuer, and is taught in the CIA's own Tradecraft Primer (2009 edition).

What would prove us wrong?

Before we publish a story, we write down exactly what evidence would force us to correct or take it back, and we publish that list right with the story. Look for the Premortem section above. If any of those scenarios later turns out to be true, the Corrections and Updates log on this page records what changed and when. We are betting on the public record being right; if the record changes, so do we.

This technique is called a premortem. It comes from Gary Klein, a decision-science researcher who wrote it up in the Harvard Business Review in 2007. Imagine the project failed; what would have killed it? Then list those things up front.

What is this story betting on?

Every Watchtower story rests on one assumption that, if it turned out to be wrong, would knock the whole thing down. We name it explicitly in the Linchpin Assumption section above, and we tell you what evidence would prove that assumption wrong. You do not have to take our word for any of it. The linchpin is there so you can stress-test the story yourself.

What if we get something wrong?

Spotted an error? Use the corrections form at the bottom of this page. Every correction we accept gets logged publicly with the date, what changed, and why. We do not silently edit. We treat our own track record as evidence too.

Corrections & Updates

No corrections or updates issued since publish. Spotted an error? Use the corrections form below.

Found an error? Have a tip?

Every Watchtower claim is tied to a primary source. If a claim, number, quote, or source link is wrong, tell us with the primary record that contradicts it. Corrections are published with the story; sources are protected.

Send a correction or tip
Embed this finding on another site

Drop this snippet into any HTML page to embed the trust strip + headline as an iframe widget:

Or cite this story directly via citation.txt (BibTeX / RIS / APA 7 / MLA 9 / plain).